Algorithm Performance Analysis
This project presents a comparative analysis of three maximal clique enumeration algorithms—Chiba & Nishizeki (1985), Tomita et al. (2006), and Eppstein et al. (2010)—highlighting their efficiency, scalability, and practical applicability. By evaluating theoretical foundations, computational complexities, and experimental performance across diverse datasets, the study identifies Eppstein et al.'s degeneracy-based approach as superior for large-scale networks, while underscoring the limitations of Chiba & Nishizeki's method in real-world scenarios. The findings emphasize the critical role of algorithmic selection in optimizing performance for modern graph analysis challenges.
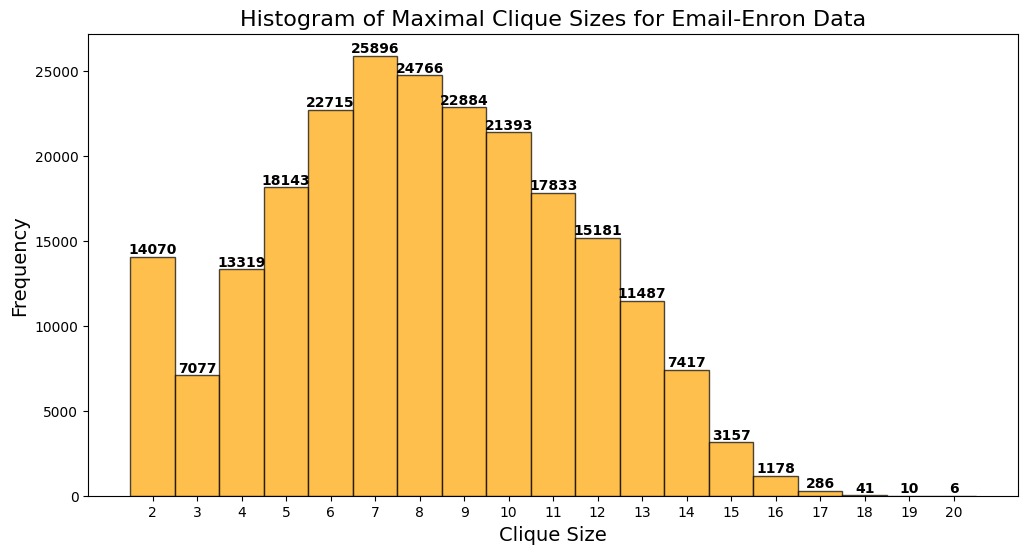
Dataset 1: Enron Email Communication Network
Description
The Enron email network represents communication patterns from approximately 500,000 emails made public during federal investigations. This real-world network contains email addresses as nodes, with undirected edges representing at least one email exchange between addresses. Non-Enron addresses act as network endpoints, while the dataset preserves original communication patterns between Enron employees.
Key Statistics
| Nodes | 36,692 |
| Edges | 183,831 |
| Largest WCC Nodes | 33,696 (91.8%) |
| Largest WCC Edges | 180,811 (98.4%) |
| Average Clustering Coefficient | 0.4970 |
| Triangles | 727,044 |
| Network Diameter | 11 |
| 90%-ile Effective Diameter | 4.8 |
Visualization of email communication patterns in the Enron network
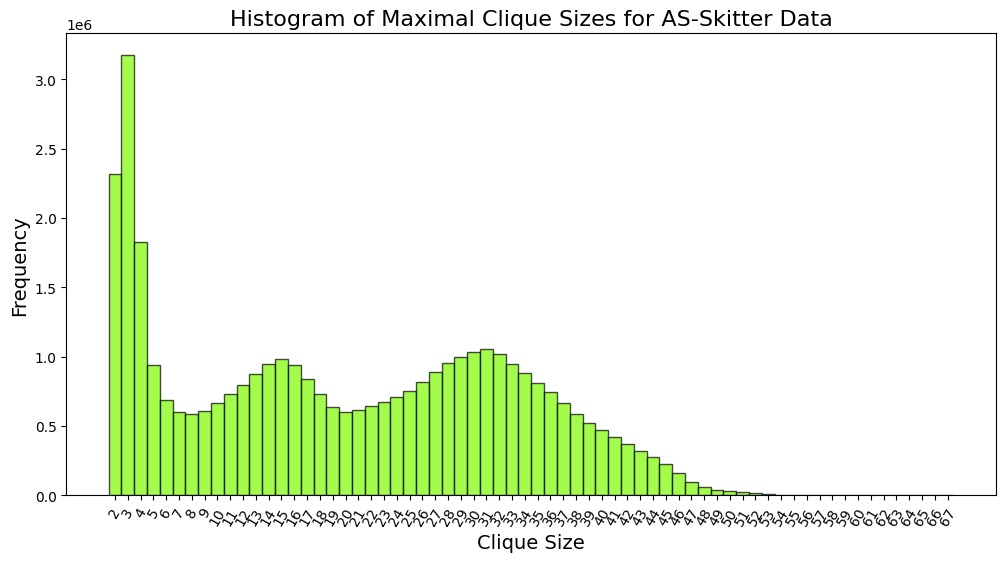
Dataset 2: CAIDA Internet Topology Graph
Description
This large-scale network graph represents internet infrastructure topology based on 2005 traceroute data from CAIDA's Skitter project. Capturing routing paths between multiple sources and millions of destinations, it provides a comprehensive view of global internet connectivity patterns at scale. The dataset preserves actual routing relationships between autonomous systems and network nodes.
Key Statistics
| Nodes | 1,696,415 |
| Edges | 11,095,298 |
| Largest WCC Nodes | 1,694,616 (99.9%) |
| Largest WCC Edges | 11,094,209 (100%) |
| Average Clustering Coefficient | 0.2581 |
| Triangles | 28,769,868 |
| Network Diameter | 25 |
| 90%-ile Effective Diameter | 6 |
Visualization of routing paths in the CAIDA Skitter internet topology
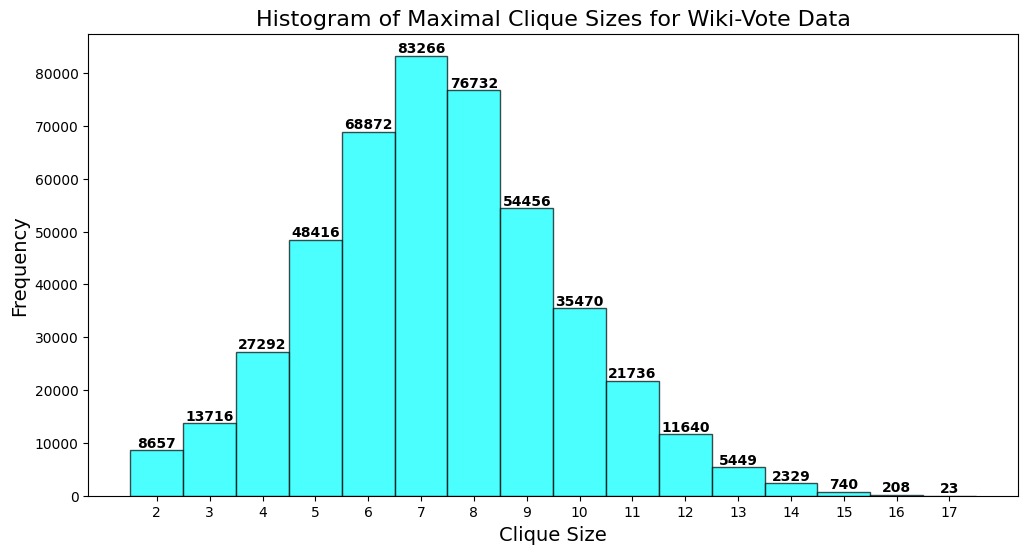
Dataset 3: Wikipedia Administrator Election Network
Description
This directed network captures voting patterns from 2,794 Wikipedia administrator elections between 2003-2008. Nodes represent users, with directed edges indicating votes cast (from voter to candidate). The dataset includes both successful promotions (1,235 elections) and unsuccessful attempts (1,559 elections), with participation from 7,066 unique users. Votes are evenly split between existing administrators and regular users, reflecting Wikipedia's collaborative governance structure.
Key Statistics
| Nodes | 7,115 |
| Edges | 103,689 |
| Largest WCC Nodes | 7,066 (99.3%) |
| Largest WCC Edges | 103,663 (100%) |
| Largest SCC Nodes | 1,300 (18.3%) |
| Largest SCC Edges | 39,456 (38.1%) |
| Average Clustering Coefficient | 0.1409 |
| Triangles | 608,389 |
| Network Diameter | 7 |
| 90%-ile Effective Diameter | 3.8 |
Visualization of voting relationships in Wikipedia's administrator elections
Research Paper 1: Worst-Case Time Complexity for Generating All Maximal Cliques
Brief Description
This paper, authored by Etsuji Tomita, Akira Tanaka, and Haruhisa Takahashi, presents a depth-first search algorithm for generating all maximal cliques in an undirected graph. The algorithm employs pruning techniques similar to the Bron–Kerbosch algorithm and outputs the maximal cliques in a tree-like form. The authors prove that the worst-case time complexity of their algorithm is O(3n/3) , which is optimal for an n-vertex graph since there can be up to 3^n/3 maximal cliques in such a graph. The paper also includes computational experiments demonstrating that the algorithm performs efficiently in practice, outperforming other existing algorithms for clique enumeration.
Algorithm Overview
The algorithm works by recursively expanding a set of vertices Q that forms a complete subgraph (clique). At each step, the algorithm explores vertices in the neighborhood of Q to find larger cliques. Two key pruning methods are used to reduce unnecessary computations:
- Pruning based on processed vertices: Once a vertex is processed, it is excluded from further expansions to avoid redundant clique generation.
- Pruning based on adjacency: The algorithm selects a vertex u that maximizes the number of adjacent vertices in the candidate set, ensuring that the search space is minimized.
Performance on Datasets
| Test Case | Total Maximal Cliques | Largest Clique Size | Execution Time |
|---|---|---|---|
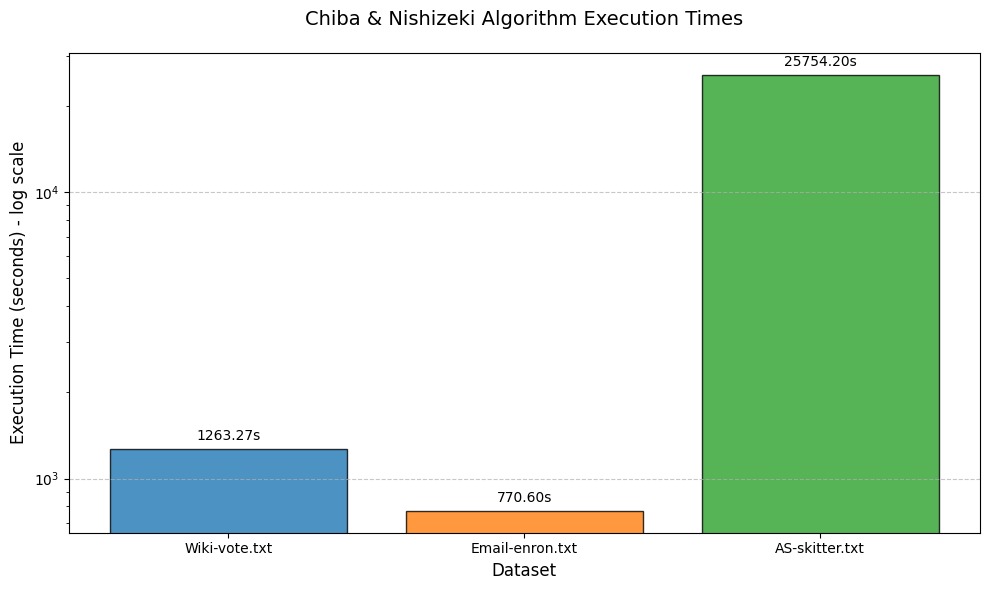
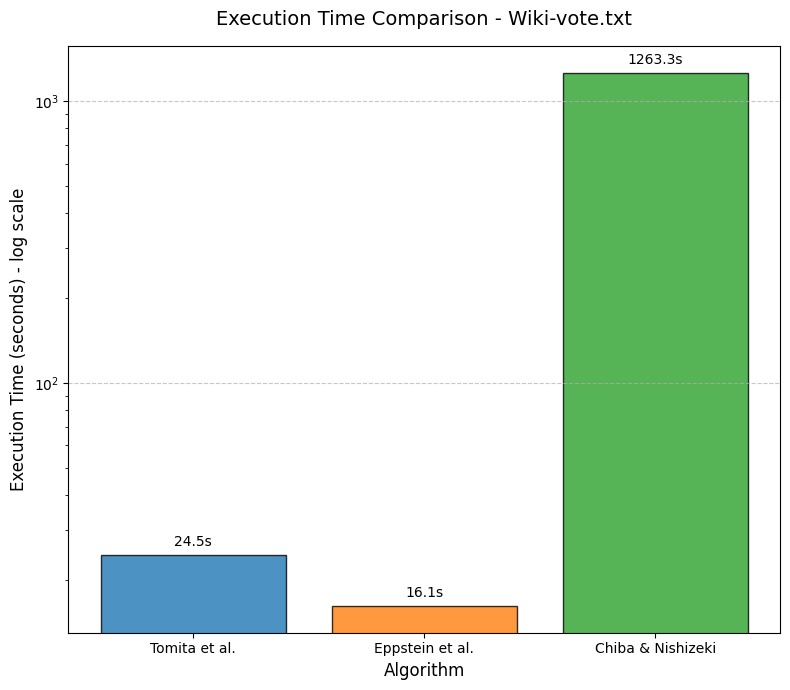
| Wiki-vote.txt | 459,002 | 17 | 24.5 sec |
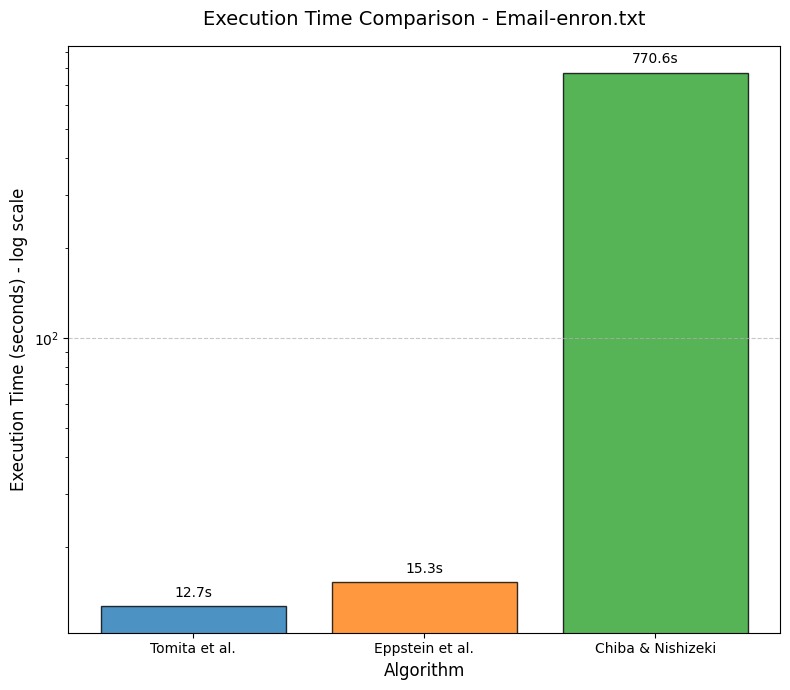
| Email-enron.txt | 226,859 | 20 | 12.7 sec |
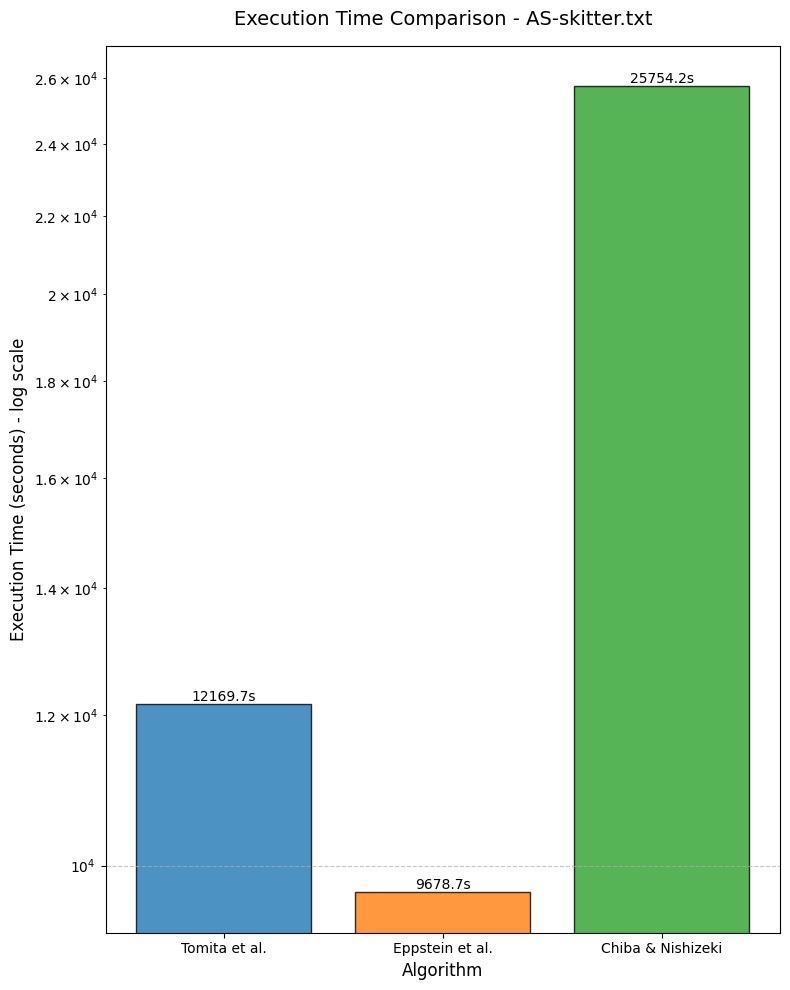
| AS-skitter.txt | 37,322,355 | 67 | 12,169.7 sec |
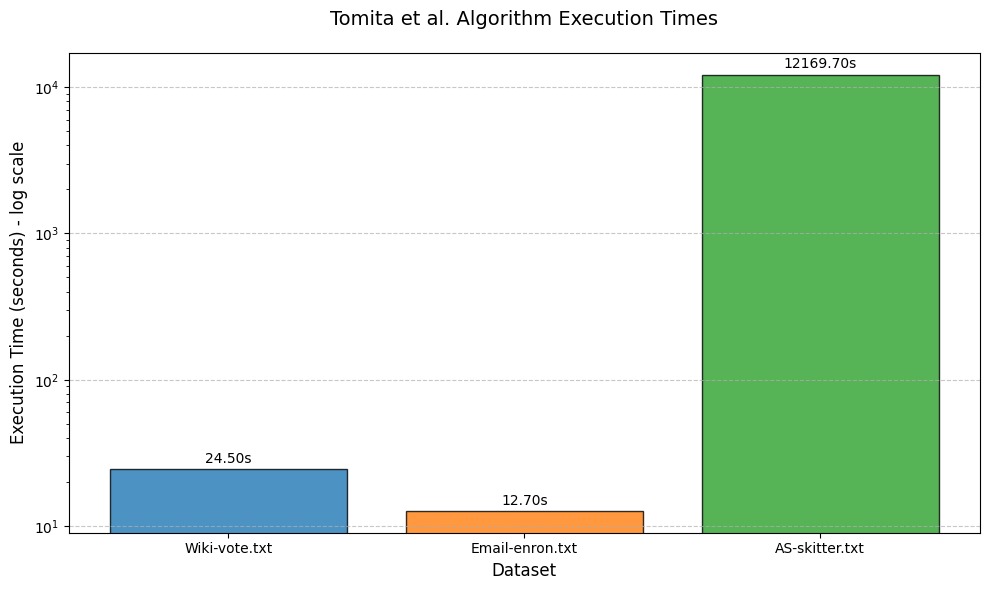
Figure 4: Performance metrics comparison using Chiba & Nishizeki's approach
Research Paper 2: Listing All Maximal Cliques in Sparse Graphs in Near-Optimal Time
Brief Description
This paper, authored by David Eppstein, Maarten Löffler, and Darren Strash, presents a near-optimal algorithm for enumerating all maximal cliques in sparse graphs, parametrized by the graph's degeneracy. The degeneracy of a graph is a measure of its sparsity, defined as the smallest number d such that every subgraph contains a vertex of degree at most d. The authors modify the classic Bron–Kerbosch algorithm to achieve a running time of O(dn3^d/3), which is nearly optimal. They also provide matching upper and lower bounds on the number of maximal cliques in a graph with degeneracy d, showing that the worst-case number of maximal cliques is theta(d(n−d)3^d/3).
Algorithm Overview
The algorithm is a modified version of the Bron–Kerbosch algorithm, which is a recursive backtracking method for finding all maximal cliques in a graph. The key innovation in this paper is the use of a degeneracy ordering of the vertices, which ensures that each vertex has at most d neighbors that come later in the ordering. This ordering significantly reduces the number of recursive calls and improves the algorithm's efficiency.
The algorithm works as follows:
- Degeneracy Ordering: The vertices are processed in a degeneracy order, where each vertex has at most d later neighbors.
- Recursive Clique Enumeration: For each vertex v, the algorithm recursively explores cliques that include v and its later neighbors. The recursive calls are limited to the later neighbors, ensuring that the search space is small.
- Pivoting Strategy: At each step, the algorithm uses a pivoting strategy to further reduce the number of recursive calls. The pivot is chosen to maximize the number of neighbors in the candidate set, which minimizes the branching factor of the recursion.
Performance on Datasets
| Test Case | Total Maximal Cliques | Largest Clique Size | Execution Time |
|---|---|---|---|
| Wiki-vote.txt | 459,002 | 17 | 16.15 seconds |
| Email-enron.txt | 226,859 | 20 | 15.3 seconds |
| AS-skitter.txt | 37,322,355 | 67 | 9,678.7 seconds |
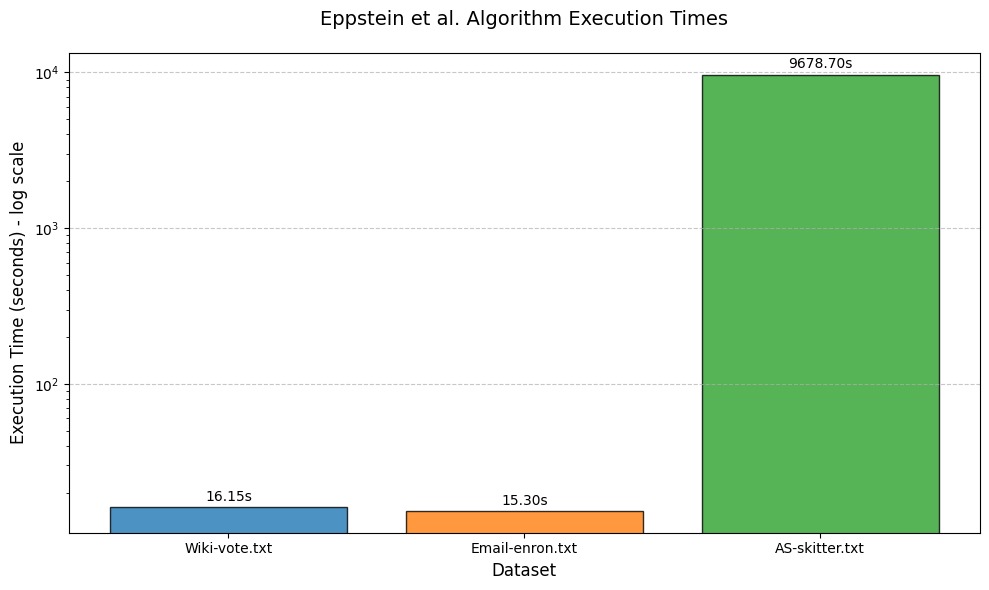
Performance metrics for Tomita et al. algorithm across different datasets (Table 2)